


Contents
The arithmetic mean is one of the most popular statistical methods that is calculated everywhere. But in itself it is absolutely unreliable. Many people know the saying that one person eats cabbage, the other meat, and on average they both eat cabbage rolls. On the example of the average salary, it is very easy to depict this. A few percent of people who earn millions will not greatly affect the statistics, but they can significantly spoil its objectivity, overestimating the figure by several tens of percent.
The lower the spread between the values, the more you can trust this statistic. Therefore, it is strongly recommended to always calculate the standard deviation along with the arithmetic mean. Today we will figure out how to do it correctly using Microsoft Excel.
Standard deviation – what is it
The standard (or standard) deviation is the square root of the variance. In turn, the latter term refers to the degree of dispersion of values. To obtain the variance, and, as a result, its derivative in the form of a standard deviation, there is a special formula, which, however, is not so important to us. It is quite complex in its structure, but at the same time it can be fully automated using Excel. The main thing is to know what parameters to pass to the function. In general, both for calculating the variance and the standard deviation, the arguments are the same.
- First we get the arithmetic mean.
- After that, each initial value is compared with the average and the difference between them is determined.
- After that, each difference is raised to the second power, after which the resulting results are added together.
- Finally, the final step is dividing the resulting value by the total number of elements in the given sample.
Having received the difference between one value and the arithmetic mean of the entire sample, we can find out the distance to it from a certain point on the coordinate line. For a beginner, all logic is clear even up to the third step. Why square the value? The fact is that sometimes the difference can be negative, and we need to get a positive number. And, as you know, a minus times a minus gives a plus. And then we need to determine the arithmetic mean of the resulting values. The dispersion has several properties:
- If you derive the variance from a single number, then it will always be zero.
- If a random number is multiplied by a constant A, then the variance will increase by a factor of A squared. Simply put, the constant can be taken out of the dispersion sign and raised to the second power.
- If the constant A is added to an arbitrary number or subtracted from it, then the variance will not change from this.
- If two random numbers, denoted, for example, by the variables X and Y, do not depend on each other, then in this case the formula is valid for them. D(X+Y) = D(X) + D(Y)
- If we make changes to the previous formula and try to determine the variance of the difference between these values, then it will also be the sum of these variances.
Standard deviation is a mathematical term derived from dispersion. Getting it is very simple: just take the square root of the variance.
The difference between variance and standard deviation is purely in the plane of units, so to speak. The standard deviation is much easier to read because it is not shown in squares of a number, but directly in values. In simple words, if in the numerical sequence 1,2,3,4,5 the arithmetic mean is 3, then, accordingly, the standard deviation will be the number 1,58. This tells us that, on average, one number deviates from the average number (which is 1,58 in our example), by XNUMX.
The variance will be the same number, only squared. In our example, it is slightly less than 2,5. In principle, you can use both the variance and the standard deviation for statistical calculations, you just need to know exactly which indicator the user is working with.
Calculating Standard Deviation in Excel
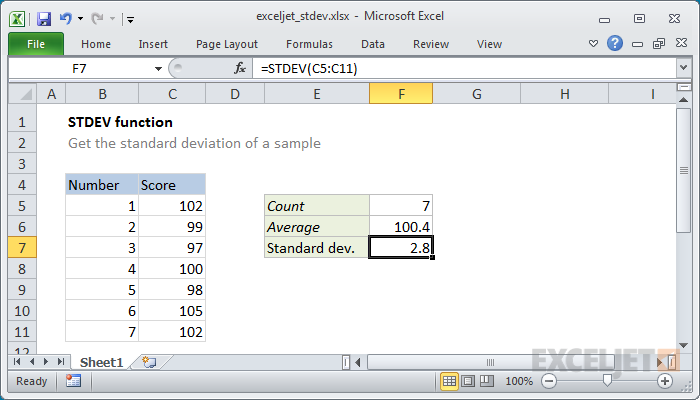
We have two main variants of the formula. The first is calculated on the sample population. The second – according to the general. To calculate the standard deviation for a sample population, you need to use the function STDEV.V. If it is necessary to carry out the calculation for the general population, then it is necessary to use the function STDEV.G.
The difference between the sample population and the general population is that in the first case, the data are processed directly, on the basis of which the arithmetic mean and standard deviation are calculated. If we are talking about the general population, then this is the entire set of quantitative data related to the phenomenon under study. Ideally, the sample should be completely representative. That is, the study should involve people who can be correlated with the general population in equal proportions. For example, if in a conditional country 50% of men and 50% of women, then the sample should have the same proportions.
Therefore, the standard deviation for the general population may differ slightly from the sample, since in the second case the original figures are smaller. But in general, both functions work the same way. Now we will describe what needs to be done in order to call them. And you can do it in three ways.
Method 1. Manual formula entry
Manual entry is a rather complicated method, at first glance. However, everyone should own it if they want to be a professional Excel user. Its advantage is that you do not need to call the argument input window at all. If you practice well, it will be much faster than using the other two methods. The main thing is that the fingers are trained. Ideally, every Excel user should be familiar with the blind method to enter formulas and functions quickly.
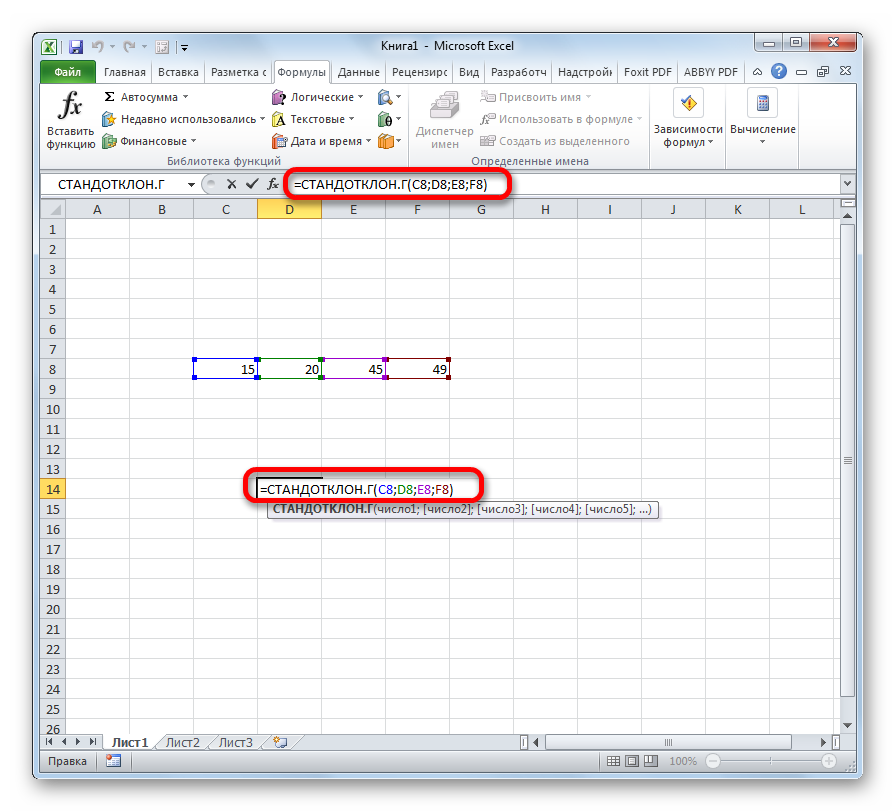
- We make a left mouse click on the cell in which the formula for obtaining the standard deviation will be written. You can also enter it as an argument to any other of the functions. In this case, you need to click on the formula entry line, and then start entering in the argument where the result should be displayed.
- The general formula is as follows: =STDEV.Y(number1(cell_address1), number2(cell_address2),…). If we use the second option, then everything is done in exactly the same way, only the letter G in the function name is changed to B. The maximum number of supported arguments is 255.

- After entering the formula is completed, we confirm our actions. To do this, press the enter key.
Thus, to calculate the standard deviation, we need to use the same arguments as for obtaining the arithmetic mean. Everything else the program can do on its own. Also, as an argument, you can use a whole range of values, on the basis of which the calculation of the standard deviation will be carried out. Now let’s look at other methods that will be more understandable for a novice Excel user. But in the long run, they will need to be abandoned because:
- Entering the formula manually can save a lot of time. An Excel user who remembers the formula and its syntax has a significant advantage over the person who is just starting out and looking for the desired function in the list in the Function Wizard or on the ribbon. In addition, keyboard input itself is much faster than using a mouse.
- Less tired eyes. You don’t have to constantly switch focus from a table to a window, then to another window, then to the keyboard, and then back to the table. This also helps to significantly save time and effort, which can then be spent on processing real information, rather than maintaining formulas.
- Entering formulas manually is much more flexible than using the following two methods. The user can immediately specify the required cells of the range without selecting it directly, or look at the entire table at once, avoiding the risk that the dialog box will block it.
- Using formulas manually is a kind of bridge to writing macros. Of course, this will not help you learn the VBA language, but it forms the right habits. If a person is used to giving commands to a computer using the keyboard, it will be much easier for him to master any other programming language, including developing macros for spreadsheets.
But of course yes. Using other methods is much better if you are new and just starting out. Therefore, we turn to the consideration of other ways to calculate the standard deviation.
Method 2. Formulas Tab
Another method available to the user who wants to get the standard deviation from the range is to use the “Formulas” tab in the main menu. Let’s describe in more detail what needs to be done for this:
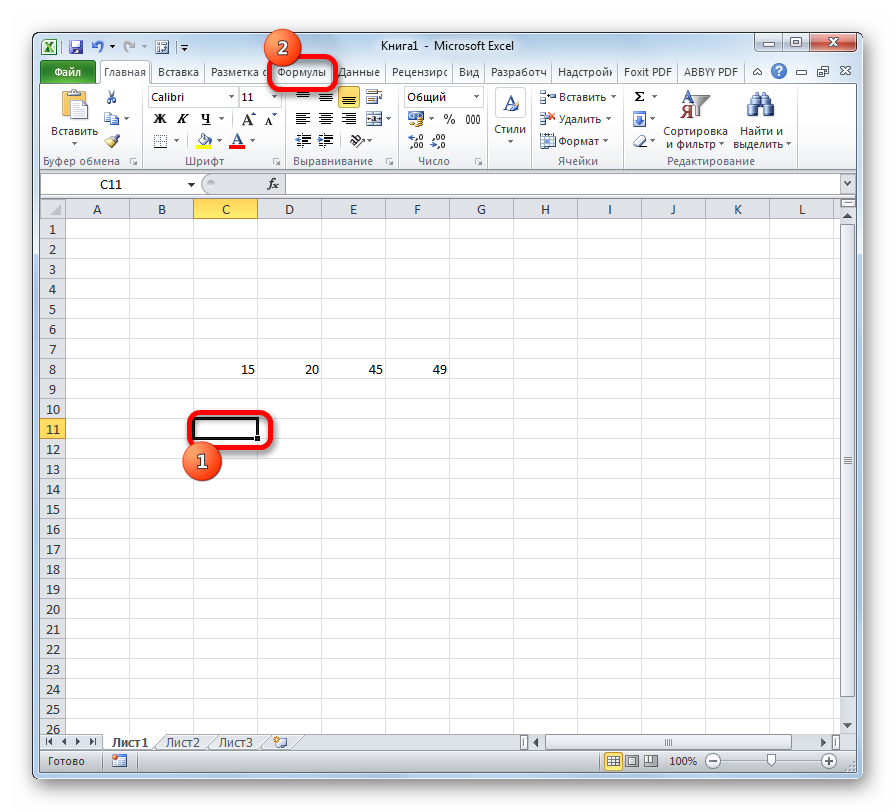
- Select the cell in which we want to write the result.
- After that, we find the “Formulas” tab on the ribbon and go to it.
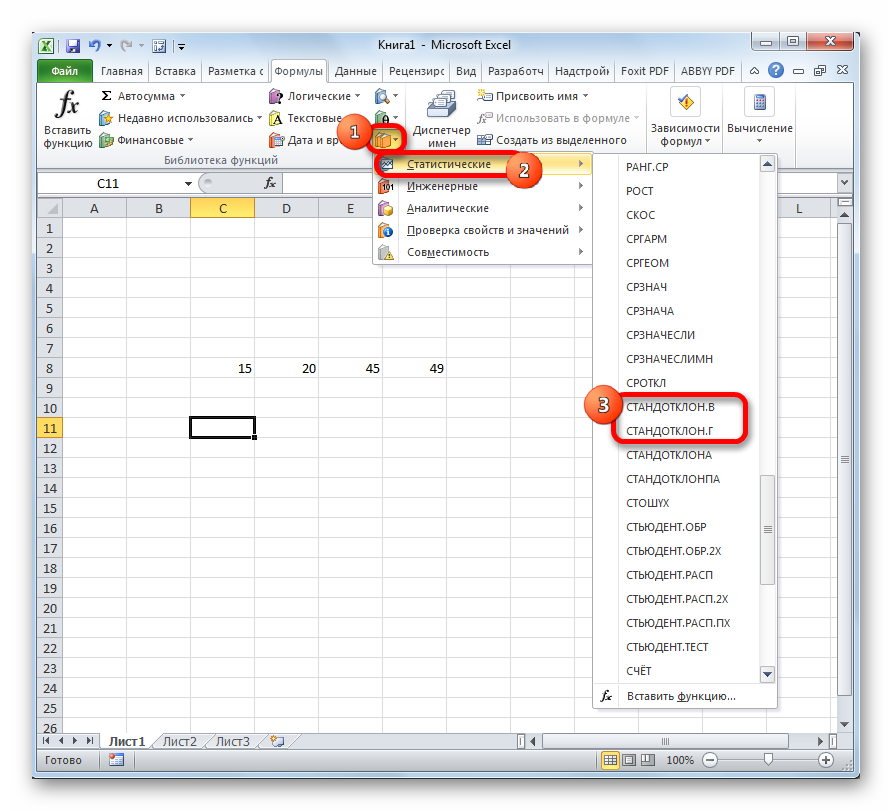
- Let’s use the block “Library of functions”. There is a “More Features” button. In the list that will be, we will find the item “Statistical”. After that, we choose which kind of formula we are going to use.
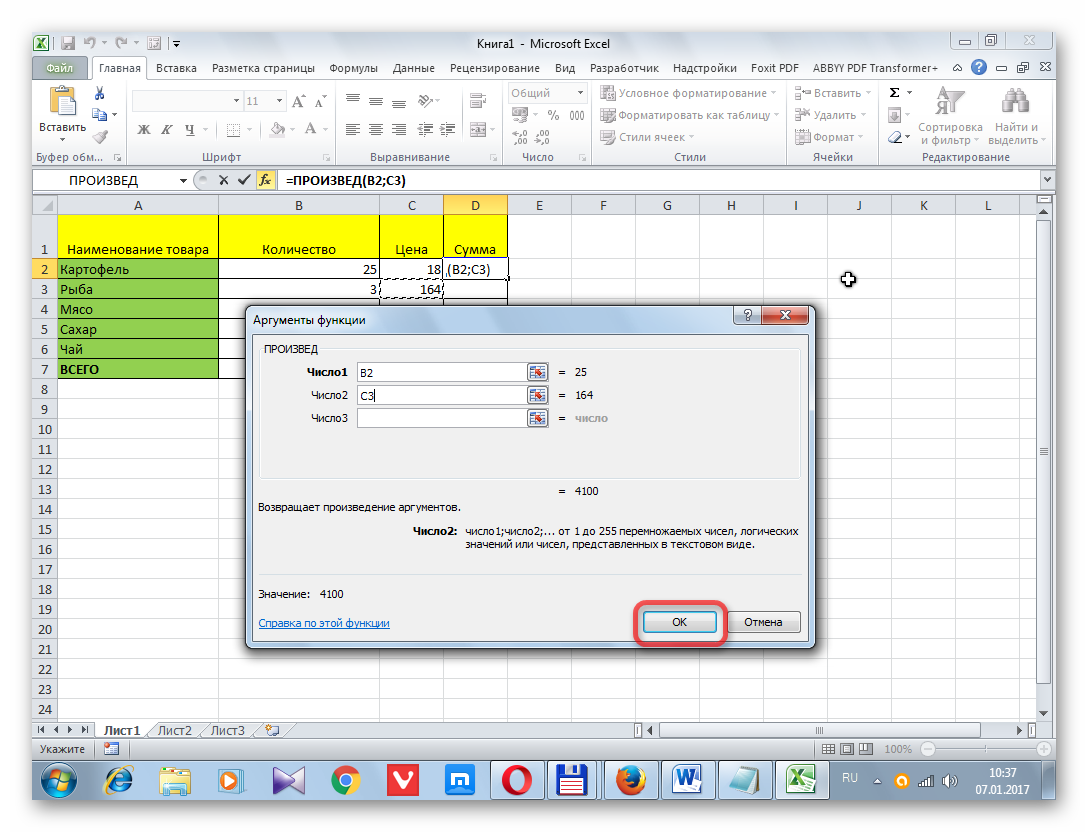
- After that, a window for entering arguments appears. In it, we indicate all the numbers, links to cells or ranges that will take part in the calculations. After we’re done, click the “OK” button.
The advantages of this method:
- Speed. This method is quite fast and allows you to enter the desired formula in just a few clicks.
- Accuracy. There is no risk of accidentally writing the wrong cell or writing the wrong letter and then wasting time reworking.
We can say that this is the number two best way after manual input. BUT the third method is also useful in some situations.
Method 3: Function Wizard
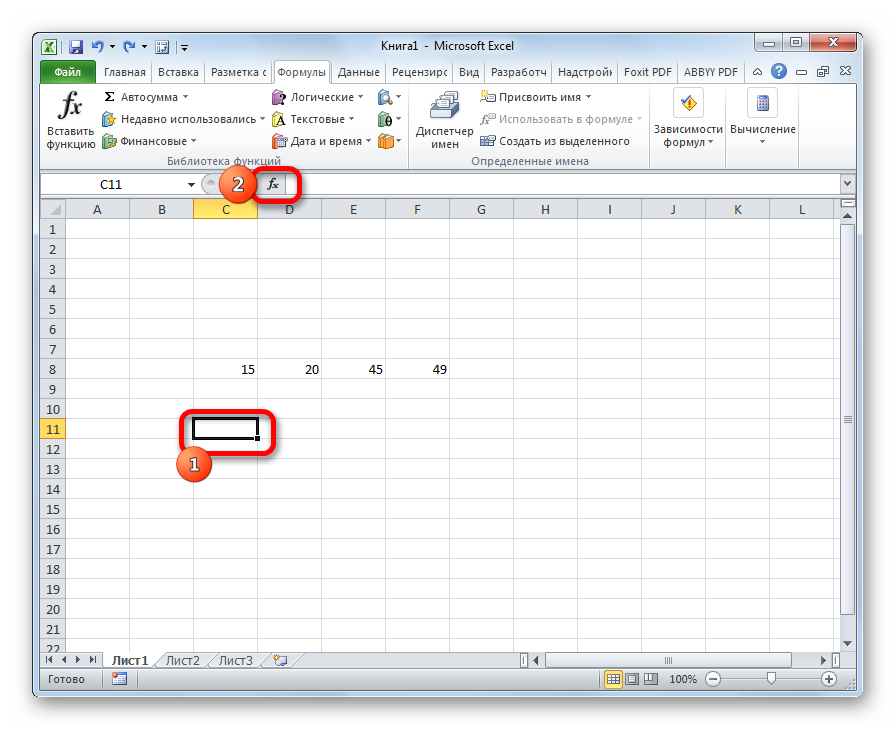
The Function Wizard is another convenient method for entering formulas for beginners who have not yet memorized the names and syntax of functions. The button for launching the Function Wizard is located near the formula input line. Its main advantage for a beginner against the background of the previous methods lies in the detailed program hints, which function is responsible for what and which arguments to enter in what order. It is two letters – fx. We click on it. 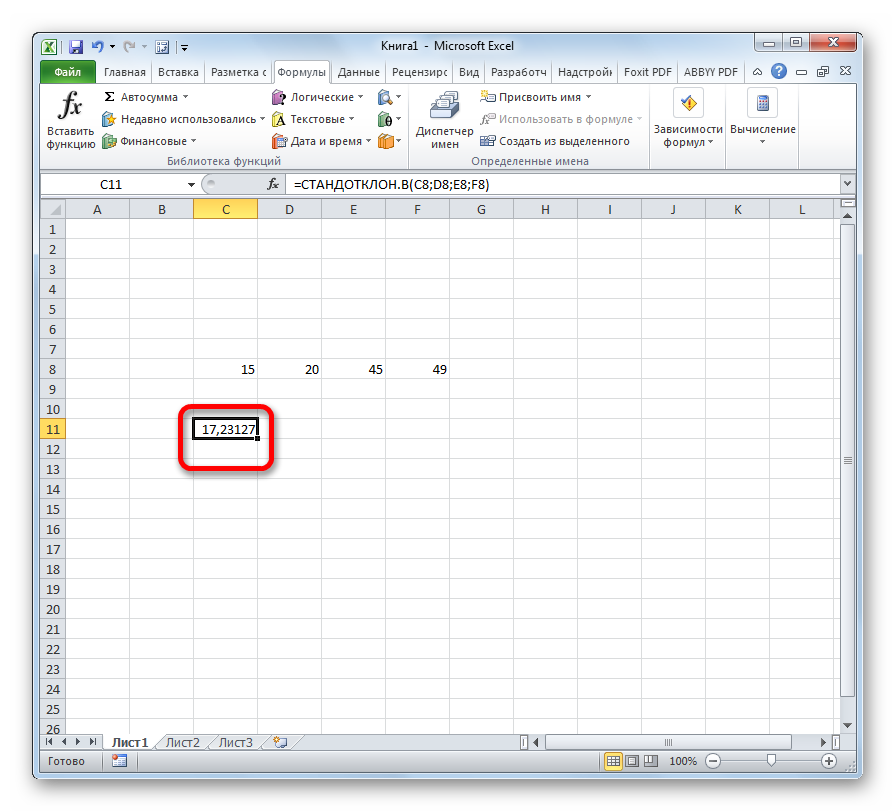
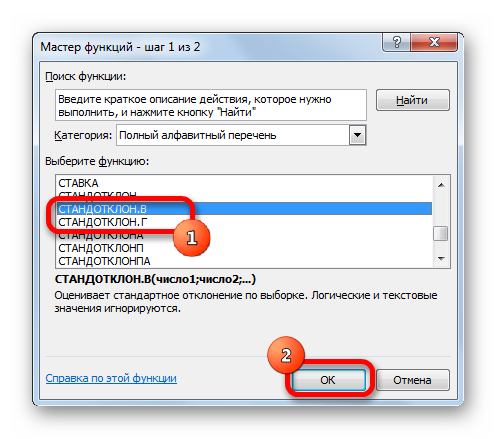
After that, a list of functions will appear. You can either try to find it in the full alphabetical list, or open the “Statistical” category, where you can also find this operator.
We can see in the list that the function STDEV is still present. This is done to make old files compatible with the new version of Excel. However, it is strongly recommended that you use the new features listed above, because at some point this deprecated feature may no longer be supported.
After we click OK, we will have the option to open the arguments window. Each argument is a single number, an address per cell (if it contains a numeric value), or ranges of values that will be used for the arithmetic mean and standard deviation. After we enter all the arguments, click on the “OK” button. The data will be entered in the cell in which we entered the formula.
Conclusion
Thus, it is not difficult to calculate the standard deviation using Excel. And the function itself is the basis of statistical calculations, which is intuitive. After all, it is obvious that not only the average value is important, but also the spread of values from which the arithmetic mean is derived. After all, if half of the people are rich and half are poor, then in fact there will be no middle class. But at the same time, if we derive the arithmetic mean, it turns out that the average citizen is just a representative of the middle class. But it sounds, at least, strange. All in all, good luck with this feature.