


Contents
Regression analysis is a set of statistical methods that allow you to study the influence of one or more independent variables on the dependent one. Let’s see how you can perform this analysis in Excel.
Content
Enabling the analysis function in the program
First you need to activate the function of the program with which we will carry out the analysis. To do this, we do the following:
- Open the menu “file”.
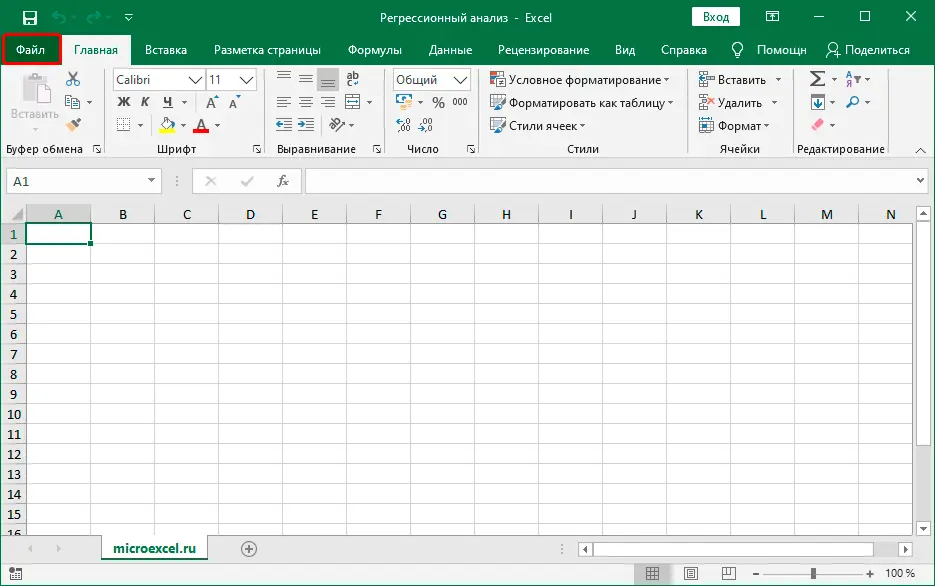

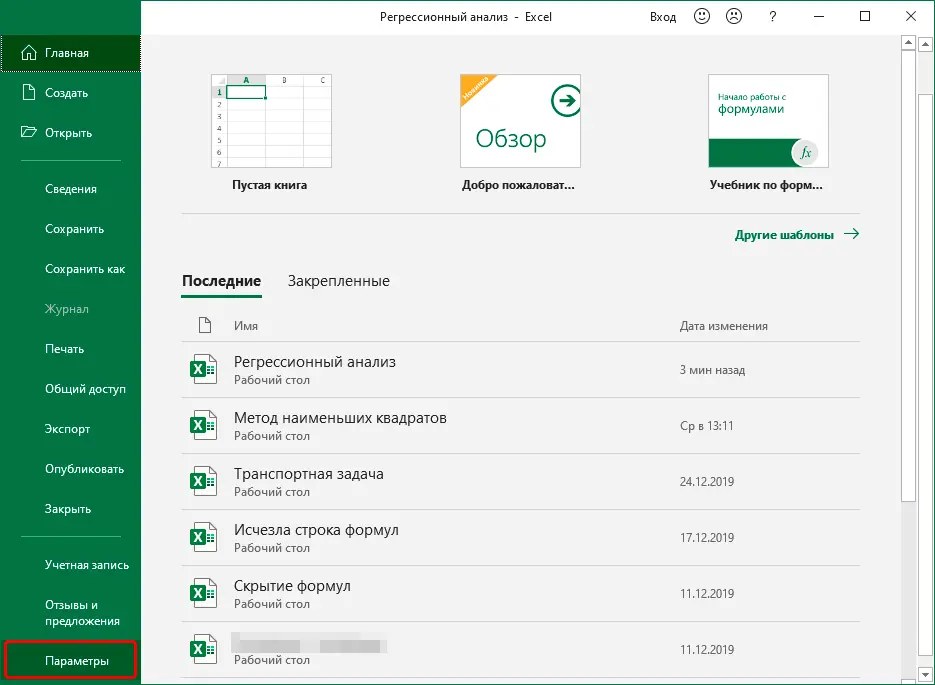
- Click on an item “Parameters”.

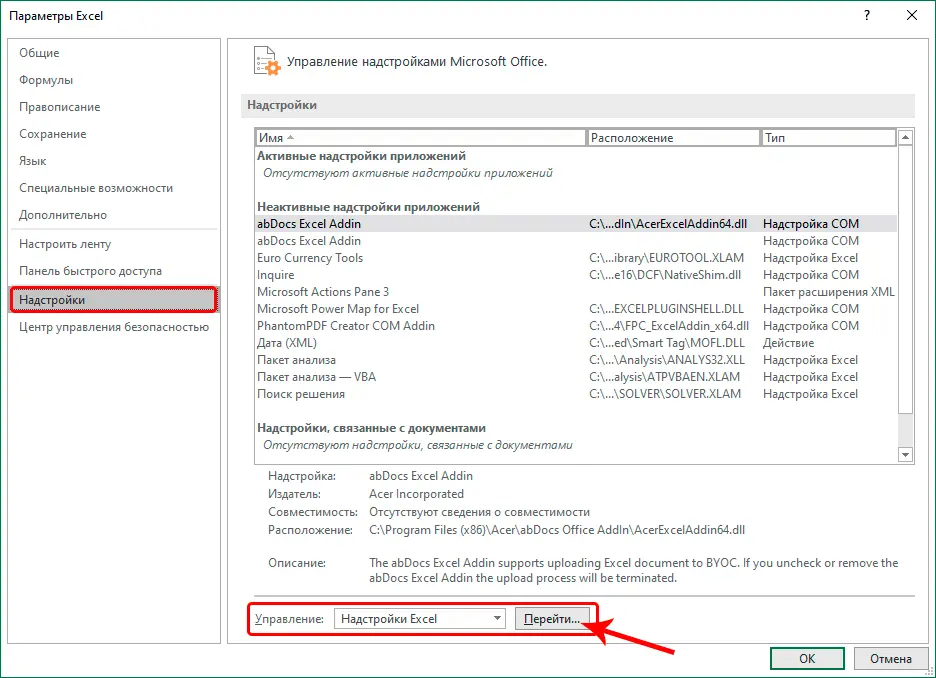
- At the bottom of subsection content “Add-ons” choose value “Excel add-ins” for parameter “Control”, then click “Go”.

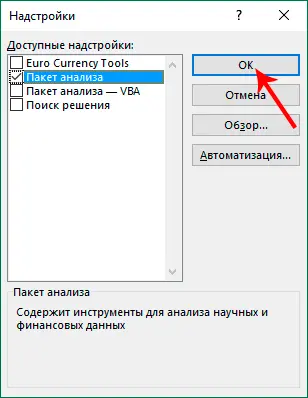
- In the add-on management window, select “Analysis Package” and click OK.

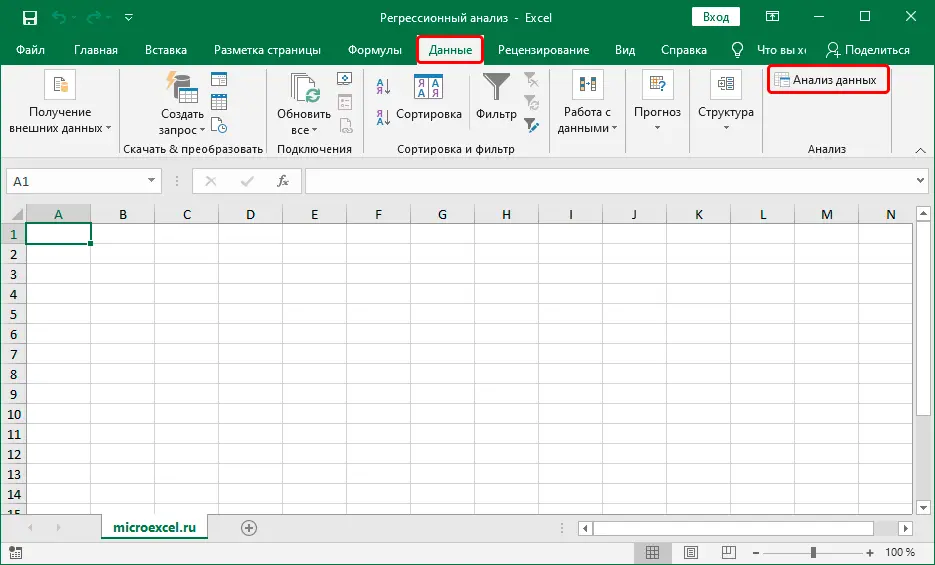
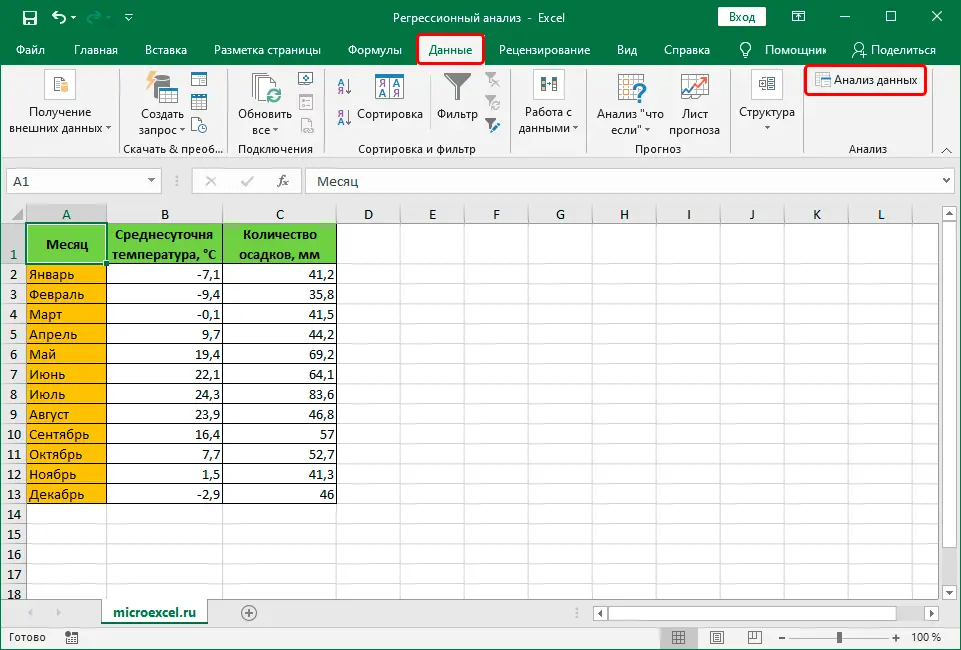
- Go to the tab “Data”to check if the function has appeared “Data analysis” in the tool group “Analysis”.

Linear regression analysis
There are several types of regressions: linear, hyperbolic, multiple, logarithmically linear, non-linear, inverse, paired.
In this article, we will consider linear regression. In general, its function looks like this:
y = to0+a1x1+a2x2+…anxn
In this equation:
- Y is the variable whose influence is to be found;
- X – factors influencing the variable;
- A – regression coefficients that determine the significance of factors;
- N is the total number of factors.
To make it clearer, let’s look at a specific practical example. Let’s say we have a table that provides information on the average daily temperature and rainfall, broken down by month.
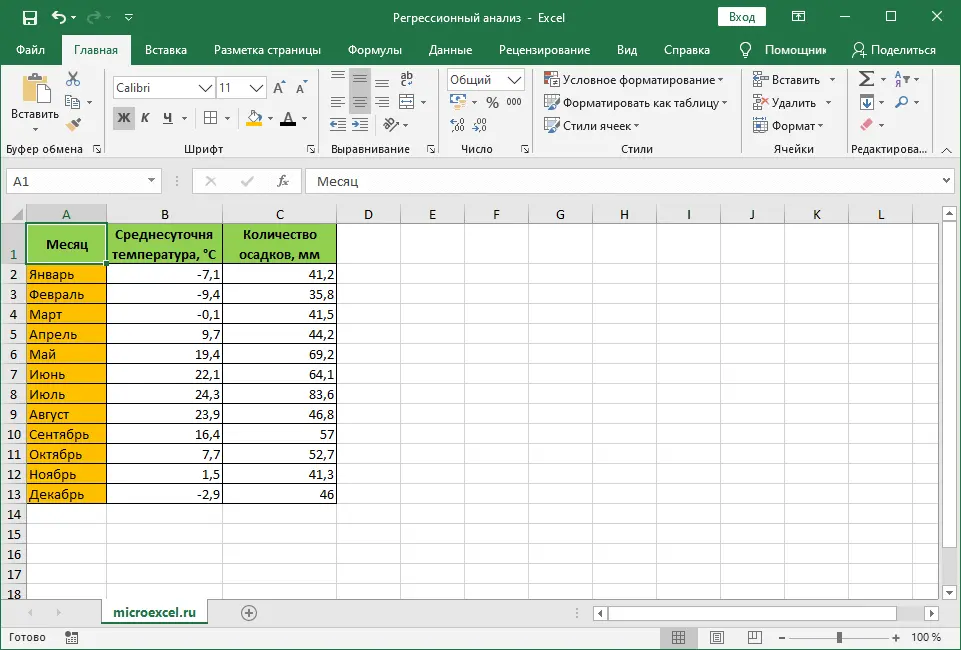
Our task is to find out how temperature affects precipitation. Start doing it.
- Clicking on the button “Data analysis”.

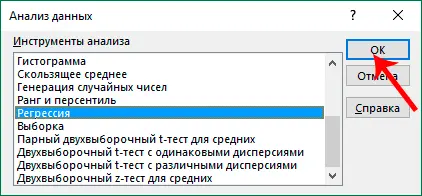
- In the window that opens, mark the item “Regression”, then click OK.

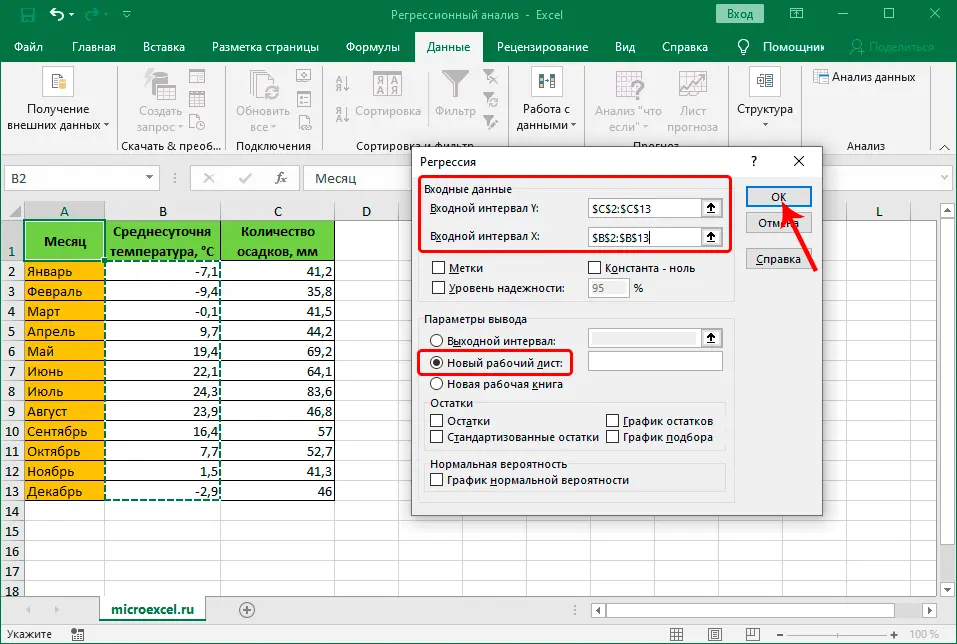
- A window will appear in front of us in which we need to configure the regression parameters:
- in the field “Input interval_Y” we write the coordinates of the range of cells in which the variables are located, the influence on which we need to find out. We have this column “Precipitation amount, mm”. The range coordinates can be specified either manually using the keys on the keyboard, or by selecting it in the table itself with the left mouse button pressed.
- in the field “Input interval_X” specify the coordinates of the range of cells with data whose influence we need to find. In our case, this is a column “Average daily temperature”.
- The remaining parameters are optional and, most often, left blank. We have the ability to set labels, percent confidence values, a constant-zero, a normal probability plot, and so on. Perhaps the most important thing here is the way the results of the analysis are displayed. The options are: on a new sheet (default), in a new workbook, or in a specified range on the same sheet. We will leave everything as it is and press the button OK.

Analysis of the results
After correctly filling in all the parameters and pressing the button OK the results of the analysis are displayed (depending on the selected method). In our case, on a separate sheet.
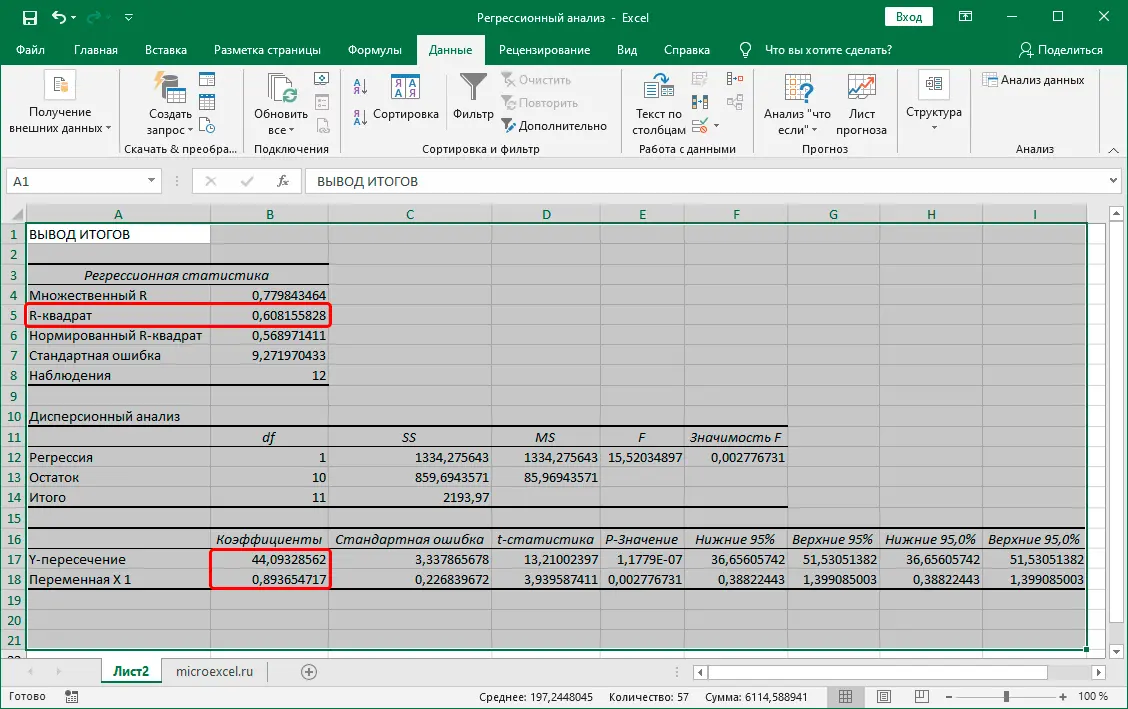
The key indicator here is R-square (determination coefficient), the value of which characterizes the quality of the model. A value of at least 0,5 (or 50%) is considered acceptable.
You should also pay attention to the cell located at the intersection of the line “Y-intersection” and column “Coefficients”. This shows what the value will be Y (precipitation) if all other factors are equal to zero.
Cell at line intersection “Variable X 1” and column “Coefficients” contains a value characterizing the degree of dependence Y from X. Coef. 0,89 in our case, indicates a fairly strong relationship between the variables.
Conclusion
Regression analysis is a complex and time-consuming task that requires certain mathematical and statistical knowledge. But with the help of standard Excel tools, its implementation can be greatly facilitated.