


Residents consider Russia the world leader in terms of the amount of alcohol consumed per capita. But the rating released by the World Health Organization (WHO) shows that Russians are not even among the top three, the first places are occupied by completely different countries, from which no one expected this.
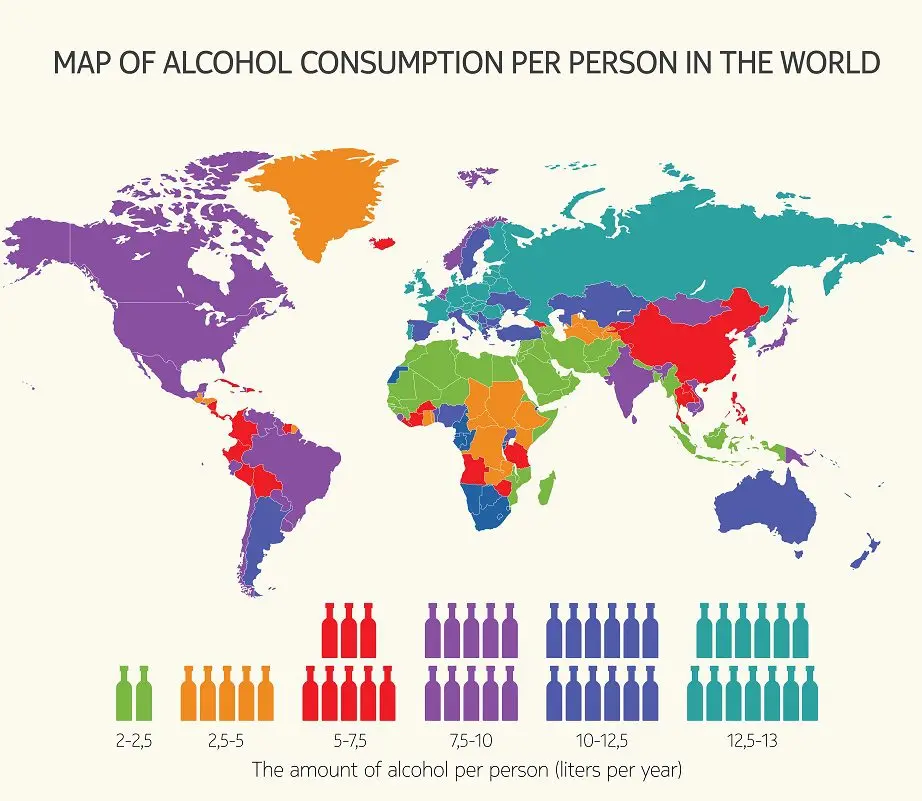
Every nation has its favorite alcoholic drink. Therefore, the WHO decided to count alcohol consumption in liters of pure ethyl alcohol. To make the statistics even more representative, people over the age of 15 were taken into account.
Unexpectedly the most drinking country in the world turned out to be Moldova. On average, each Moldovan drinks 18,22 liters of pure alcohol per year. Next come Uganda and the Czech Republic. With a result of 15,76 liters, Russia was in fifth place, with a slight lag, sixth place went to Ukraine – 15,6 liters. Most strong drinks (40% or more) are consumed by residents of South Korea – 9.57 liters. According to this indicator, Russia ranks sixth, Ukraine – 13th.
Earlier, some experts expressed the opinion that Finland would be the leader in alcohol, but their expectations were not met, the Finns took only 25th place. Another well-known drinkers in Europe, the Germans, were in 24th place.
The most teetotal country in the world became Yemen, where the average amount of alcohol consumed is calculated in milliliters. Near Yemen are other Muslim countries: Pakistan, Somalia, Libya and Kuwait, where harsh Islamic laws do not allow residents to drink alcohol. Violators will face severe punishment in accordance with Sharia law.
The WHO is confident that if the country’s average exceeds 8 liters per year, the nation is degrading, as the next generations will suffer from genetic alcoholism. This means that most European countries and the US are at risk.

The full version of the ranking of countries by the amount of alcohol consumed per capita is as follows:
| Country | Accounted consumption | Unrecorded consumption | Total consumption | Beer | Wine | Strong Spirits | Other |
|---|---|---|---|---|---|---|---|
| Moldavia | 8,22 | 10 | 18,22 | 4,57 | 4,67 | 4,42 | 0 |
| Uganda | 10,93 | 1 | 11,93 | 6,51 | 0 | 0,18 | 10,5 |
| Czech Republic | 14,97 | 1,48 | 16,45 | 8,51 | 2,33 | 3,59 | 0,39 |
| Hungary | 12,27 | 4 | 16,27 | 4,42 | 4,94 | 3,02 | 0,14 |
| Russia | 11,03 | 4,73 | 15,76 | 3,65 | 0,1 | 6,88 | 0,34 |
| Ukraine | 8,1 | 7,5 | 15,6 | 2,69 | 0,58 | 5,21 | 0,02 |
| Estonia | 13,77 | 1,8 | 15,57 | 5,53 | 1,09 | 9,19 | 0,43 |
| Andorra | 14,08 | 1,4 | 15,48 | 3,93 | 5,69 | 3,14 | 0 |
| Romania | 11,3 | 4 | 15,3 | 4,07 | 2,33 | 4,14 | 0 |
| Slovenia | 12,19 | 3 | 15,19 | 4,1 | 5,1 | 1,33 | 0 |
| Byelorussia | 11,22 | 3,91 | 15,13 | 1,84 | 0,8 | 4,08 | 2,67 |
| Croatia | 12,61 | 2,5 | 15,11 | 4,66 | 5,8 | 1,91 | 0,14 |
| Lithuania | 12,03 | 3 | 15,03 | 5,6 | 1,8 | 4,5 | 0,6 |
| Республика Корея | 11,8 | 3 | 14,8 | 2,14 | 0,06 | 9,57 | 0,04 |
| Portugal | 12,45 | 2,1 | 14,55 | 3,75 | 6,65 | 1,27 | 0,51 |
| Ireland | 13,39 | 1 | 14,41 | 7,04 | 2,75 | 2,51 | 1,09 |
| France | 13,3 | 0,36 | 13,66 | 2,31 | 8,14 | 2,62 | 0,17 |
| United Kingdom | 11,67 | 1,7 | 13,37 | 4,93 | 3,53 | 2,41 | 0,67 |
| Denmark | 11,37 | 2 | 13,37 | 5,06 | 4,43 | 1,78 | 0 |
| Slovakia | 10,33 | 3 | 13,33 | 3,9 | 1,7 | 5,4 | 0 |
| Netherlands | 9,55 | 0,5 | 10,05 | 4,72 | 3,26 | 1,56 | 0 |
| Austria | 12,6 | 0,64 | 13,24 | 6,7 | 4,1 | 1,6 | 0,4 |
| Luxembourg | 12,01 | 1 | 13,01 | 1,59 | 8,16 | 2 | 0 |
| Germany | 11,81 | 1 | 12,81 | 6,22 | 3,15 | 2,3 | 0 |
| Finland | 9,72 | 2,8 | 12,52 | 4,59 | 2,24 | 2,82 | 0,31 |
| Latvia | 9,5 | 3 | 12,5 | 3,61 | 1,1 | 6,24 | 0,1 |
| Bulgaria | 11,24 | 1,2 | 12,44 | 3,53 | 2,44 | 4,88 | 0,1 |
| Nigeria | 9,78 | 2,5 | 12,28 | 0,54 | 0,01 | 0,02 | 9,17 |
| St. Lucia | 11,35 | 0,5 | 11,85 | 3,49 | 0,71 | 8,21 | 0,31 |
| Spain | 10,22 | 1,4 | 11,62 | 4,52 | 3,59 | 1,31 | 0,61 |
| Armenia | 10,05 | 1,3 | 11,35 | 1,05 | 0,39 | 0,65 | 9,36 |
| Serbia | 9,97 | 1,12 | 11,09 | 4,4 | 2,21 | 3,42 | 0,04 |
| Switzerland | 10,56 | 0,5 | 11,06 | 3,1 | 5,1 | 1,8 | 0,1 |
| Kazakhstan | 6,06 | 4,9 | 10,96 | 1,69 | 0,3 | 4,19 | 0,01 |
| Belgium | 9,77 | 1 | 10,77 | 5,49 | 3,55 | 0,62 | 0,03 |
| Greece | 8,95 | 1,8 | 10,75 | 2,2 | 4,51 | 2,38 | 0,13 |
| Italy | 8,33 | 2,35 | 10,68 | 1,73 | 6,38 | 0,42 | 0 |
| Azerbaijan | 7,3 | 3,3 | 10,6 | 7 | 0,03 | 0,97 | 0 |
| Seychelles | 9,59 | 1 | 10,59 | 7,15 | 3,15 | 1,59 | 0 |
| Grenada | 9,85 | 0,5 | 10,35 | 3,16 | 0,42 | 7,15 | 0,04 |
| Sweden | 6,7 | 3,6 | 10,3 | 2,6 | 2,9 | 1,1 | 0 |
| Palau | 9,1 | 1 | 10,1 | 8,68 | 0,52 | 2,1 | 0 |
| Poland | 9,55 | 3,7 | 13,25 | 4,72 | 3,26 | 1,56 | 0 |
| Australia | 9,89 | 0,13 | 10,02 | 4,56 | 3,12 | 1,16 | 1,02 |
| Argentina | 8 | 2 | 10 | 2,49 | 4,62 | 0,52 | 0,2 |
| Niue | 8,85 | 1 | 9,85 | 4,63 | 0,11 | 2,95 | 0 |
| Rwanda | 6,8 | 3 | 9,8 | 0,54 | 0 | 0,01 | 6,44 |
| Canada | 7,77 | 2 | 9,77 | 4,1 | 1,5 | 2,1 | 0 |
| Sierra Leone | 6,72 | 3 | 9,72 | 0,46 | 0,01 | 0,02 | 6,06 |
| Bosnia and Herzegovina | 9,63 | 0 | 9,63 | 2,22 | 0,34 | 7,08 | 0 |
| New Zealand | 9,12 | 0,5 | 9,62 | 4,09 | 3,04 | 1,37 | 0,81 |
| Namibia | 5,87 | 3,75 | 9,62 | 4,35 | 0,48 | 1,3 | 0,35 |
| Guyana | 7,5 | 2 | 9,5 | 1,14 | 0,31 | 5,7 | 0,01 |
| Nepal | 7,2 | 2,2 | 9,48 | 1,15 | 0 | 0,07 | 0 |
| Burundi | 6,47 | 3 | 9,47 | 1,16 | 0,01 | 0 | 5,07 |
| South Africa | 6,96 | 2,5 | 9,46 | 3,93 | 1,17 | 1,15 | 0,75 |
| USA | 8,44 | 1 | 9,44 | 4,47 | 1,36 | 2,65 | 0 |
| Saint Kitts and Nevis | 8,93 | 0,5 | 9,43 | 3,98 | 0,18 | 6 | 0,1 |
| Ecuador | 4,01 | 5,37 | 9,38 | 2,3 | 0,07 | 1,69 | 0 |
| Gabon | 7,32 | 2 | 9,32 | 5,38 | 0,8 | 1,69 | 0 |
| Cyprus | 8,26 | 1 | 9,26 | 3,25 | 2,97 | 2,95 | 0,12 |
| Brazil | 6,16 | 3 | 9,16 | 3,36 | 0,33 | 2,49 | 0,03 |
| Bahamas | 8,16 | 0,6 | 8,76 | 3,99 | 1,55 | 5,27 | 0,23 |
| Sao Tome and Principe | 5,82 | 2,92 | 8,74 | 1,12 | 3,4 | 0,83 | 0 |
| Chile | 6,55 | 2 | 8,55 | 2,03 | 2,59 | 2,16 | 0,04 |
| Macedonia | 5,61 | 2,9 | 8,51 | 2,11 | 1,62 | 2,08 | 0 |
| Mexico | 5,02 | 3,4 | 8,42 | 3,96 | 0,02 | 1,09 | 0,03 |
| Venezuela | 6,83 | 1,4 | 8,23 | 5,19 | 0,07 | 1,65 | 0 |
| Uruguay | 6,14 | 2 | 8,14 | 1,33 | 3,95 | 1,21 | 0,06 |
| Japan | 7,83 | 0,2 | 8,03 | 1,72 | 0,29 | 3,37 | 2,61 |
| Botswana | 4,96 | 3 | 7,96 | 2,56 | 0,04 | 0 | 1,88 |
| Paraguay | 6,38 | 1,5 | 7,88 | 3,48 | 0,97 | 1,77 | 0,19 |
| Dominica | 7,34 | 0,5 | 7,84 | 0,5 | 0,8 | 6,69 | 0,07 |
| Norway | 6,21 | 1,6 | 7,81 | 2,98 | 2 | 1,28 | 0,11 |
| Cameroon | 4,97 | 2,6 | 7,57 | 2,05 | 0,05 | 0 | 2,6 |
| Antigua and Barbuda | 6,76 | 0,46 | 7,22 | 2,67 | 1,7 | 5,04 | 0,09 |
| Thailand | 6,37 | 0,71 | 7,08 | 1,75 | 0,02 | 4,69 | 0 |
| Burkina Faso | 4,48 | 2,5 | 6,98 | 0,41 | 0,09 | 0,42 | 3,77 |
| Barbados | 6,41 | 0,5 | 6,91 | 2,9 | 0,73 | 3,78 | 0,17 |
| Peru | 2,9 | 4 | 6,9 | 2,16 | 0,32 | 0,61 | 0 |
| Panama | 5,85 | 1 | 6,85 | 3,71 | 0,22 | 1,91 | 0,01 |
| Tanzania | 4,75 | 2 | 6,75 | 0,57 | 0,02 | 0,15 | 4,51 |
| Laos | 5,73 | 1 | 6,73 | 1,42 | 0,03 | 4,35 | 0 |
| Albania | 4,58 | 2,1 | 6,68 | 1,61 | 0,94 | 2,3 | 0,02 |
| Haiti | 5,99 | 0,62 | 6,61 | 0,01 | 0,01 | 5,2 | 0 |
| Côte d’Ivoire | 4,48 | 2 | 6,48 | 0,61 | 0,33 | 0,05 | 3,55 |
| The Dominican Republic | 5,76 | 0,65 | 6,41 | 2,69 | 0,14 | 2,92 | 0,01 |
| Georgia | 3,9 | 2,5 | 6,4 | 0,76 | 0,83 | 2,56 | 0,02 |
| Philippines | 4,38 | 2 | 6,38 | 1,29 | 0,02 | 2,91 | 0 |
| Iceland | 5,91 | 0,4 | 6,31 | 3,67 | 1,95 | 1,33 | 0,1 |
| Trinidad and Tobago | 5,78 | 0,5 | 6,28 | 3,1 | 0,11 | 2,78 | 0,04 |
| Colombia | 4,17 | 2 | 6,17 | 2,71 | 0,08 | 1,44 | 0,02 |
| Surinam | 5,19 | 0,9 | 6,09 | 2 | 0,13 | 3,26 | 0,05 |
| Equatorial Guinea | 5,31 | 0,77 | 6,08 | 0,45 | 4,18 | 0 | 0 |
| Belize | 5,07 | 1 | 6,07 | 3,89 | 0,13 | 1,78 | 0,01 |
| China | 4,21 | 1,7 | 5,91 | 1,5 | 0,15 | 2,51 | 0,23 |
| Puerto-Rico | 5,47 | 0,28 | 5,75 | 3,68 | 0,34 | 1,35 | 0,05 |
| Swaziland | 5,7 | 0 | 5,7 | 1,64 | 0,21 | 0,15 | 3,05 |
| Costa Rica | 4,15 | 1,4 | 5,55 | 2,29 | 0,18 | 1,71 | 0,02 |
| Lesotho | 1,9 | 3,65 | 5,55 | 1,24 | 0 | 0,01 | 0,69 |
| Cuba | 4,41 | 1,1 | 5,51 | 1,48 | 0,05 | 2,94 | 0,01 |
| Micronesia | 4,5 | 1 | 5,5 | 1,43 | 1,31 | 0,6 | 0 |
| Vc | 4,94 | 0,5 | 5,44 | 2,55 | 0,12 | 3,16 | 0,05 |
| Angola | 3,8 | 1,6 | 5,4 | 1,81 | 1,37 | 1,12 | 0,41 |
| Nicaragua | 3,77 | 1,6 | 5,37 | 1,13 | 0,03 | 2,55 | 0 |
| Bolivia | 2,62 | 2,5 | 5,12 | 2,17 | 0,06 | 0,61 | 0 |
| Kyrgyzstan | 3,19 | 1,9 | 5,09 | 0,45 | 0,1 | 2,26 | 0,01 |
| Zimbabwe | 4,08 | 1 | 5,08 | 0,96 | 0,19 | 0,06 | 2,61 |
| Liberia | 3,47 | 1,59 | 5,06 | 0,3 | 0,01 | 3,16 | 0,01 |
| Jamaica | 3,5 | 1,5 | 5 | 1,49 | 0,11 | 1,8 | 0,1 |
| Cape Verde | 2,06 | 2,9 | 4,96 | 0,36 | 1,99 | 0,14 | 0 |
| Nauru | 2,33 | 2,5 | 4,83 | 2,24 | 0,08 | 0 | 0 |
| Samoa | 3,8 | 1 | 4,8 | 3,31 | 0,08 | 0,24 | 0 |
| Cambodia | 1,77 | 3 | 4,77 | 0,74 | 0,02 | 1,21 | 0 |
| Turkmenistan | 2,33 | 2,3 | 4,63 | 0,21 | 0,9 | 1,22 | 0 |
| Honduras | 3,08 | 1,4 | 4,48 | 1,29 | 0,04 | 1,87 | 0 |
| Chad | 0,38 | 4 | 4,38 | 0,23 | 0,01 | 0,02 | 0,15 |
| Malta | 3,85 | 0,42 | 4,27 | 1,79 | 1,45 | 1,86 | 0,15 |
| Republic of the Congo | 2,04 | 2,23 | 4,2 | 1,76 | 0 | 0,11 | 0,12 |
| Kenya | 1,64 | 2,5 | 4,14 | 0,84 | 0,02 | 0,51 | 0,55 |
| Guatemala | 2,43 | 1,6 | 4,03 | 1,12 | 3,92 | 1,2 | 0,05 |
| Ethiopia | 0,52 | 3,5 | 4,02 | 0,19 | 0,01 | 0,13 | 0,25 |
| Zambia | 2,35 | 1,5 | 3,85 | 0,42 | 0,01 | 0,27 | 1,62 |
| Tonga | 3,28 | 0,5 | 3,78 | 0,89 | 2,29 | 0,64 | 0,18 |
| Vietnam | 1,07 | 2,7 | 3,77 | 1,13 | 0,01 | 0,02 | 0 |
| Mauritius | 2,72 | 1 | 3,72 | 1,92 | 0,32 | 0,39 | 0 |
| Kiribati | 1,71 | 2 | 3,71 | 1,56 | 0,02 | 0,02 | 0 |
| Ck | 3,2 | 0,5 | 3,7 | 0,54 | 1,39 | 3,45 | 0 |
| Guinea-Bissau | 2,58 | 1,1 | 3,68 | 0,24 | 0,66 | 0,53 | 1,75 |
| Bahrain | 3,56 | 0,1 | 3,66 | 1,91 | 0,52 | 1,24 | 0 |
| Salvador | 2,61 | 1 | 3,61 | 0,88 | 0,04 | 1,57 | 0 |
| Uzbekistan | 1,64 | 1,9 | 3,54 | 0,28 | 0,19 | 1,3 | 0 |
| Papua – New Guinea | 1,49 | 2 | 3,49 | 0,57 | 0,02 | 0,9 | 0 |
| Gambia | 2,4 | 0,99 | 3,39 | 0,19 | 0,06 | 0,04 | 2,07 |
| Tajikistan | 0,39 | 3 | 3,39 | 0,08 | 0,02 | 0,29 | 0 |
| CAR | 1,65 | 1,7 | 3,35 | 0,21 | 0,02 | 0,03 | 1,37 |
| DR Congo | 1,97 | 1,26 | 3,3 | 0,32 | 0,01 | 0,02 | 1,67 |
| Malawi | 1,24 | 2 | 3,24 | 0,39 | 0,11 | 0,67 | 0,21 |
| Ghana | 1,47 | 1,5 | 2,97 | 0,4 | 0,07 | 0,03 | 0,97 |
| Israel | 2,39 | 0,5 | 2,89 | 0,97 | 0,18 | 1,3 | 0,04 |
| Djibouti | 1,37 | 1,5 | 2,87 | 0,78 | 0,07 | 0,46 | 0 |
| Mozambique | 1,56 | 1 | 2,56 | 0 | 0 | 0,27 | 1,08 |
| Tuvalu | 1,94 | 0,5 | 2,44 | 0,71 | 0,02 | 0,58 | 0 |
| Fiji | 1,43 | 1 | 2,43 | 1,46 | 0,02 | 0,58 | 0 |
| Iraq | 0,2 | 2,21 | 2,41 | 0,07 | 0 | 0,13 | 0 |
| Sudan | 1,56 | 0,82 | 2,38 | 0,52 | 0,09 | 0,79 | 0,05 |
| Lebanon | 1,73 | 0,5 | 2,23 | 0,36 | 0,56 | 0,78 | 0,01 |
| Benin | 1,15 | 1 | 2,15 | 0,49 | 0,14 | 0,15 | 0,3 |
| Brunei | 1,76 | 0,25 | 2,01 | 1,67 | 0,02 | 0,05 | 0 |
| Togo | 0,99 | 1 | 1,99 | 0,43 | 0,32 | 0,06 | 0,22 |
| Turkey | 1,37 | 0,5 | 1,87 | 0,24 | 0,08 | 1,35 | 0 |
| Mongolia | 1,24 | 0,5 | 1,74 | 0,14 | 0 | 0,22 | 0,74 |
| Solomon Islands | 1,16 | 0,5 | 1,66 | 0,66 | 0,03 | 0,4 | 0 |
| Singapore | 0,55 | 1 | 1,55 | 1,45 | 0,25 | 0,4 | 0 |
| Eritrea | 0,94 | 0,6 | 1,54 | 0,56 | 0 | 0,25 | 0 |
| Morocco | 0,46 | 1 | 1,46 | 0,23 | 0,17 | 0,06 | 0 |
| Syria | 1,13 | 0,3 | 1,43 | 0,04 | 0,32 | 0,69 | 0 |
| Madagascar | 0,78 | 0,55 | 1,33 | 0,34 | 0,11 | 0,32 | 0 |
| Tunisia | 1,09 | 0,2 | 1,29 | 0,67 | 0,34 | 0,04 | 0 |
| Qatar | 0,85 | 0,4 | 1,25 | 0,04 | 0,11 | 0,73 | 0,01 |
| Mali | 0,54 | 0,5 | 1,04 | 0,07 | 0 | 0,01 | 0,46 |
| Iran | 0,02 | 1 | 1,02 | 0,02 | 0 | 0 | 0 |
| Algeria | 0,66 | 0,3 | 0,96 | 0,09 | 0,07 | 0 | 0,5 |
| Oman | 0,64 | 0,3 | 0,94 | 0,27 | 0 | 0,39 | 0 |
| Vanuatu | 0,43 | 0,5 | 0,93 | 0,46 | 0,19 | 0,19 | 0 |
| Восточный Тимор | 0,36 | 0,5 | 0,86 | 0,3 | 0,01 | 0 | 0 |
| Malaysia | 0,5 | 0,32 | 0,82 | 0,38 | 0,02 | 0,08 | 0 |
| Sri Lanka | 0,35 | 0,44 | 0,79 | 0,02 | 0 | 0,33 | 0 |
| Comoros | 0,26 | 0,5 | 0,76 | 0,17 | 0,02 | 0,03 | 0 |
| India | 0,55 | 0,2 | 0,75 | 0,06 | 0,02 | 0,05 | 0 |
| Jordan | 0,41 | 0,3 | 0,71 | 0,04 | 0,01 | 0,34 | 0,01 |
| Senegal | 0,3 | 0,3 | 0,6 | 0,15 | 0,12 | 0,01 | 0 |
| Indonesia | 0,06 | 0,5 | 0,59 | 0,06 | 0 | 0 | 0 |
| Myanmar | 0,11 | 0,46 | 0,57 | 0,1 | 0 | 0,01 | 0,01 |
| Butane | 0,22 | 0,33 | 0,55 | 0,21 | 0 | 0 | 0 |
| United Arab Emirates | 0,34 | 0,2 | 0,54 | 0,3 | 0,01 | 0 | 0,02 |
| Afghanistan | 0 | 0,02 | 0,02 | 0 | 0 | 0,01 | 0 |
| Egypt | 0,27 | 0,1 | 0,37 | 0,1 | 0,02 | 0,06 | 0 |
| Guinea | 0,26 | 0,1 | 0,36 | 0,14 | 0,02 | 0,06 | 0 |
| Niger | 0,09 | 0,25 | 0,34 | 0,05 | 0,01 | 0,03 | 0 |
| Saudi Arabia | 0,05 | 0,2 | 0,25 | 0 | 0 | 0,05 | 0 |
| Bangladesh | 0 | 0,2 | 0,2 | 0 | 0 | 0 | 0 |
| Kuwait | 0 | 0,17 | 0,17 | 0 | 0 | 0 | 0 |
| Libya | 0,01 | 0,1 | 0,11 | 0 | 0 | 0 | 0 |
| Mauritania | 0,01 | 0,1 | 0,11 | 0 | 0 | 0,01 | 0 |
| Somalia | 0 | 0,1 | 0,1 | 0 | 0 | 0 | 0 |
| Pakistan | 0,01 | 0,05 | 0,06 | 0 | 0 | 0 | 0,01 |
| Yemen | 0 | 0,02 | 0,02 | 0 | 0 | 0 | 0 |
PS Although the study was conducted in 2008, its results are still relevant today. The quantity and structure (wine, beer, spirits) of alcohol consumption change very slowly. Usually each generation has its own preferences. It takes at least 10 years to see tangible changes.